 These are maps that supposedly weren't available…until they were.
From January all the way through June, citizens involved in watch-dogging the state's drafting of an anti-smog plan for North Texas had been asking if the Texas Commission on Environmental Quality had maps of the locations of all the gas compressors in the 10-county DFW "non-attainment" area for ozone.
The answer from the state, over the course of at least three regional air quality meetings in Arlington, was always no.
Then State Representative Lon Burnam asked the same question, officially, in a letter to TCEQ. About two weeks ago, he got these three maps in the mail. Thanks to Representative Burnam for his follow-though.
This dodge followed an attempt by the state to hide the emissions from these compressors in other categories besides "Oil and Gas" in an attempt to minimize the industry's air pollution impacts on DFW air quality.
You can understand why TCEQ wasn't eager to show these maps.
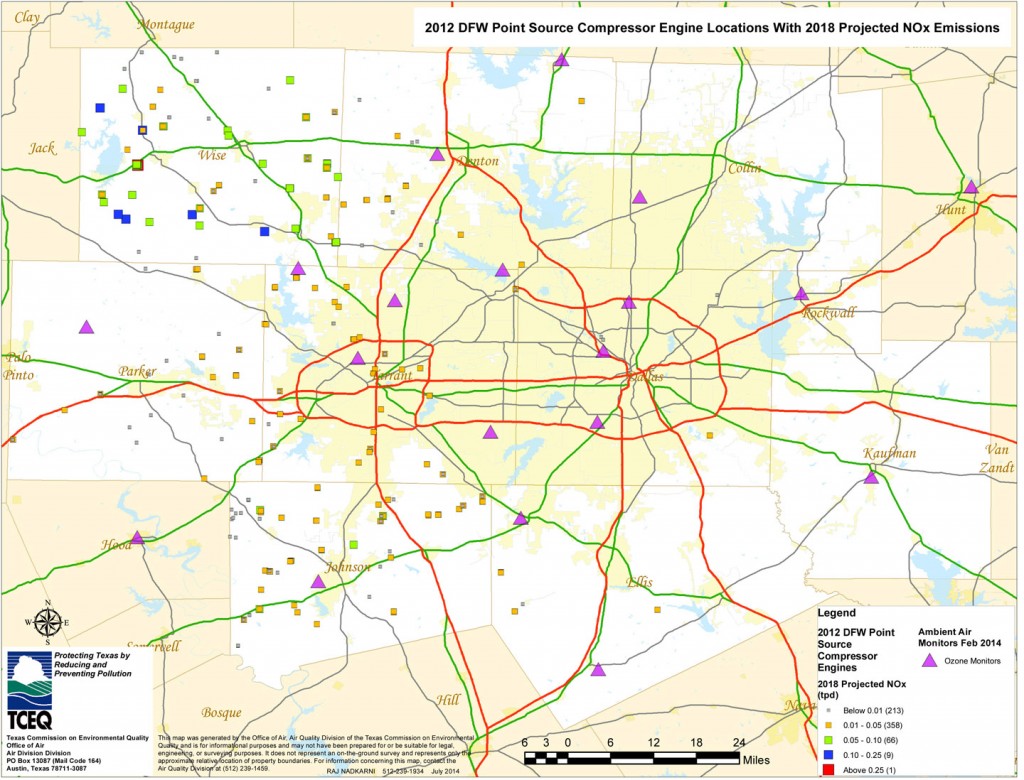
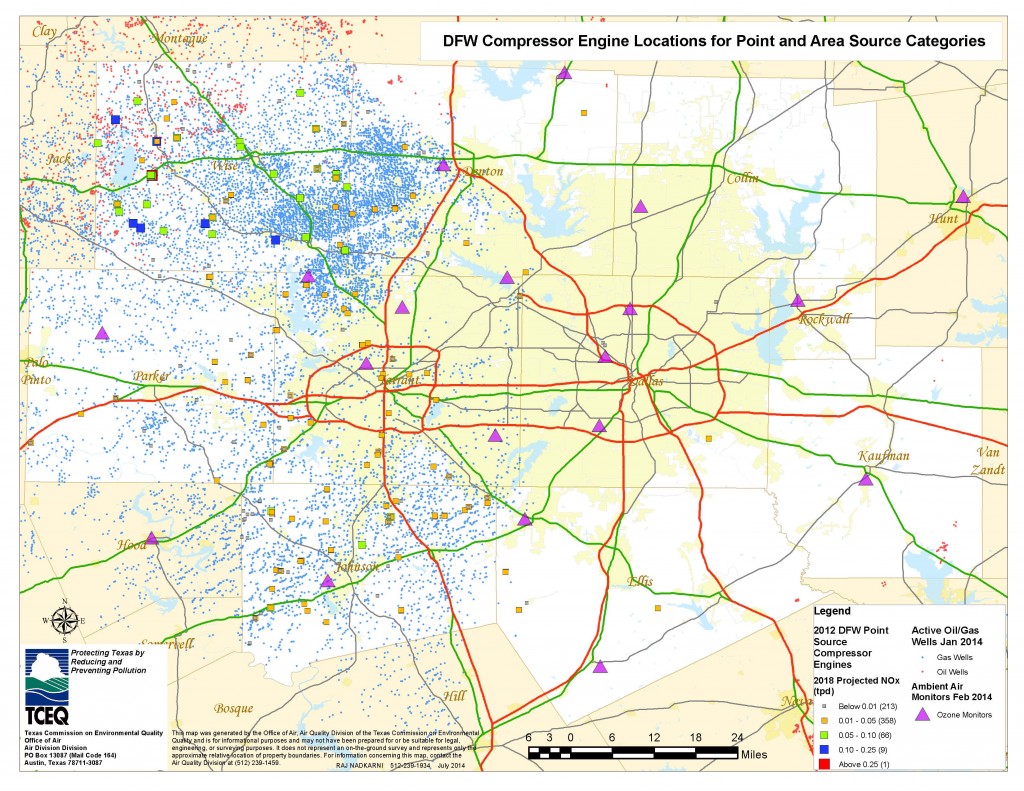
The first shows the location of 647 large gas compressors. The volume of air pollution from each of these compressors is so large that they're considered "point sources" like power plants, cement plants, manufacturing plants, etc. According to the TCEQ, these larger compressors will be emitting over 14 tons of smog-forming Nitrogen Oxide pollution PER DAY by 2018.
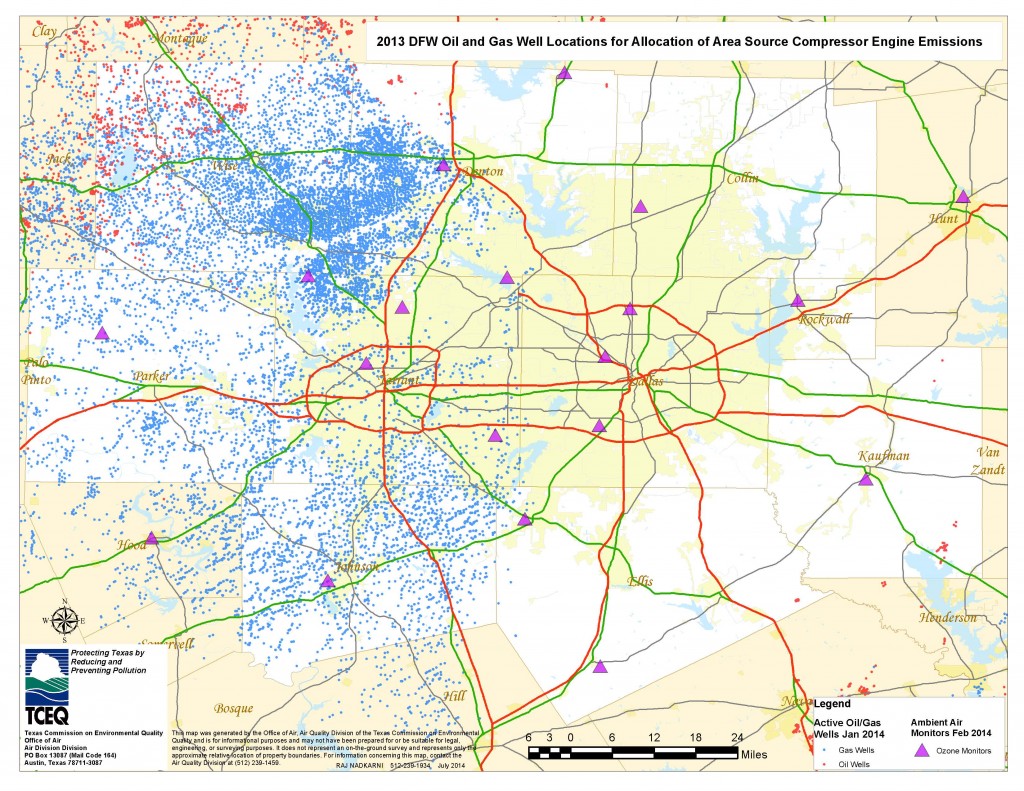
The second shows the approximate location of the thousands of smaller, "area sources" compressors. TCEQ doesn't really know how many of these there actually are – they've never counted and no inventory by industry is required.
Instead, the state bases the number and approximate location of these smaller compressors on the production rates of gas in the Barnett Shale, as reported by the Railroad Commission, and disperses them accordingly.
There's some question about whether this is the most accurate way to take a count – a lot of industry literature says you should use the number of wells and the age of the wells instead of the production rate because as a gas field gets older, operators use more compressors to extract harder-to-get gas.
This is important because while production rates in the Barnett Shale have gone down, the number of wells is increasing.
The upshot is that as impressive as all those dots seem in the second map, they may actually represent an underestimate of the number of smaller compressors on the ground. As it is, TCEQ estimates these compressors will collectively release another six and a half tons of smog-forming Nitrogen Oxides PER DAY by 2018. That's in addition to the pollution of the larger point source compressors.
The last map is a combination of the first two. In all three the region's smog monitors are the purple triangles. Please take note of their location as well.
For over a decade now it's the monitors at the Denton Airport and in Northwest Tarrant County – at Meacham Field, in Keller, in Grapevine and Eagle Mountain Lake – that have recorded the highest smog readings in the entire regions.
There's no question as pollution accumulates over Dallas and Fort Worth and blows Northwest, ozone levels get higher. It's also true the pollution plumes from the Midlothian cement plants can blow directly into the paths of many of these monitors. But can anyone look at these maps and not realize that these gas compressors are also contributing to the high readings being recorded at the monitors in Denton and Northwest Tarrant County?
That's the real reason TCEQ didn't want the public to see these maps.
There's another regional air quality meeting next Tuesday, August 12th in Arlington from 10 am to 12 noon at the North Central Texas Council of Government offices at 616 Six Flags Road. These meetings are the only chance that citizens have to ask questions of TCEQ staff about the information going into drafting the new anti-smog plan. Without those kinds of questions, we still wouldn't know how much air pollution these gas compressors are emitting, or their location. Rep. Burnam would not know what official requests to submit. Information is power. Come get a little more empowered this next Tuesday.